
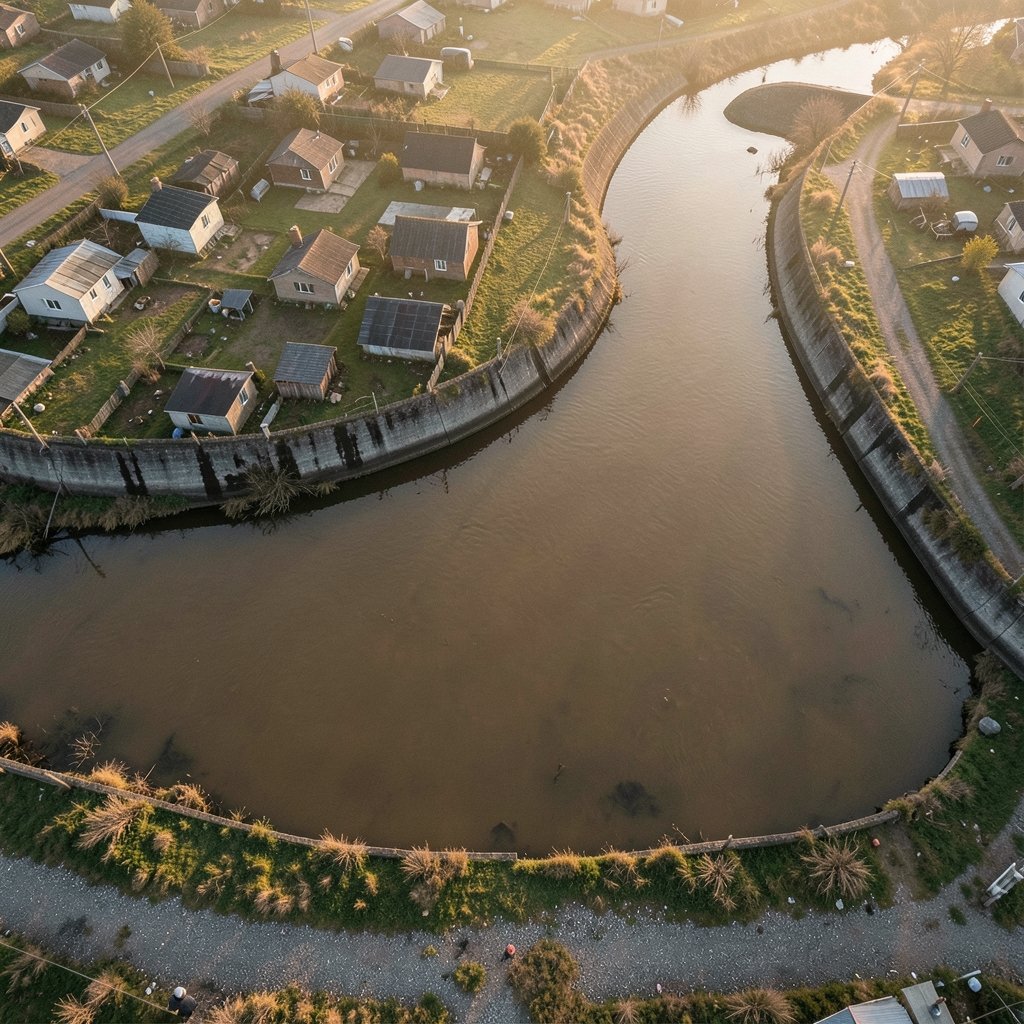
What makes a riverbank neighborhood dangerous before a single drop of rain falls? Not the water itself, but the likelihood that water will arrive. In Spanish-language risk management, that likelihood has a precise name: amenaza de inundación, or flood hazard. It is the physical possibility of flooding in a given place, independent of who lives there or how badly they would suffer. Confusing that hazard with risk is one of the most common mistakes in flood planning, and it leads to bad maps, weak budgets, and surprised homeowners.
This article unpacks what the term means, how experts measure it, why it is changing, and how to read the maps that claim to describe it.
Hazard, Vulnerability, and Risk: Three Words People Mix Up
Disaster science keeps three ideas separate, and the separation matters. Hazard is the potentially damaging physical event or condition: a river that can overflow, a coast exposed to storm surge, a city block built on a filled wetland. Vulnerability describes how easily people and assets could be harmed. Exposure counts what sits in harm’s way. Risk emerges from all three together.
The practical consequence is simple. A flood hazard can exist on an empty floodplain with zero risk, because nobody and nothing is there. The same hazard in a dense neighborhood with no evacuation route and no insurance is a serious risk. When officials say “amenaza de inundación,” they are describing the water’s behavior, not the neighborhood’s fate. That distinction shapes everything downstream: hazard maps show where water may go, while risk maps layer on buildings, people, and infrastructure.
The vocabulary itself is standardized. The United Nations Office for Disaster Risk Reduction maintains a terminology reference that defines hazard, flood, and risk in ways that national agencies borrow. When a municipality writes “amenaza” into a land-use ordinance, it is usually borrowing that same framework, whether it says so or not.
What Counts as a Flood Hazard
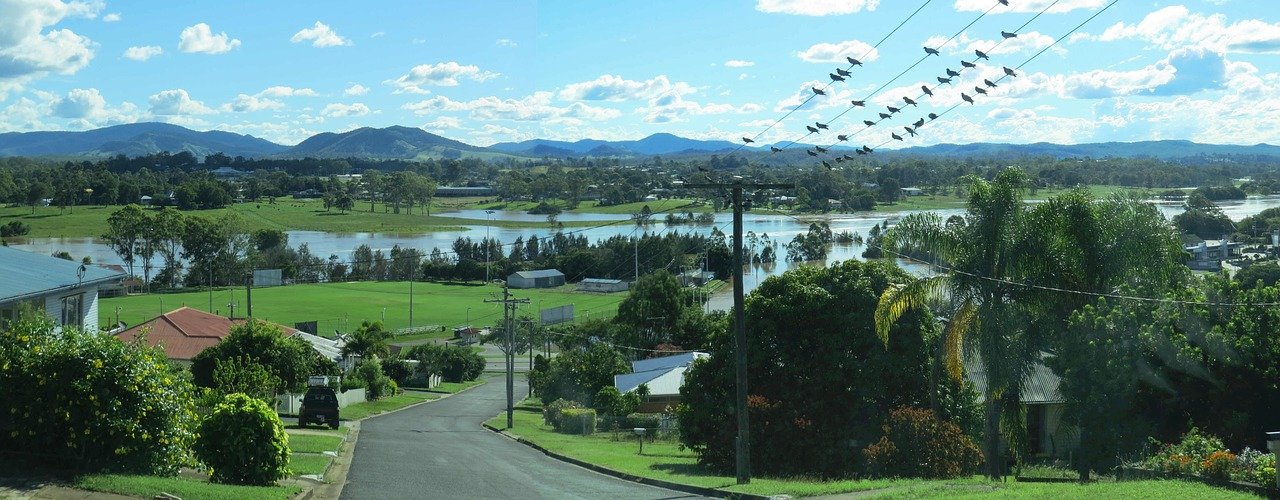
Floods are not one phenomenon. A flood hazard assessment usually has to separate at least three kinds of water:
| Flood type | What drives it | Typical warning time |
|---|---|---|
| Fluvial (river) | Rivers overflowing their banks after sustained rain or snowmelt | Hours to days |
| Pluvial (surface water) | Heavy rain overwhelming drains and soil | Minutes to hours |
| Coastal | Storm surge, tides, and wave action | Hours, but highly uncertain |
Each type produces a different hazard footprint. A river flood follows a valley; a surface-water flood pools in low spots far from any river, sometimes on hilltops with poor drainage. Coastal flooding shifts with tide and storm timing. A single property can face all three, and a hazard map built for only one of them will mislead.
There is also the question of what the water carries. Fast-moving floodwater is a hazard in its own right because of its velocity and the debris it carries, as well as its depth. Emergency managers often care as much about how quickly water rises as about how high it gets.
How Experts Measure Flood Hazard
Flood hazard is usually expressed as a return period: the statistical chance of a flood of a given size in any year. The famous “100-year flood” is not a flood that happens once a century. It is a flood with roughly a 1 percent chance of occurring in any given year, which means it can happen twice in a decade and then not again for a century. That misunderstanding is so persistent that it regularly shows up in public meetings after disasters.
In the United States, flood maps define Special Flood Hazard Areas around that 1 percent annual chance line. These maps drive insurance requirements and building rules, but they come with known limitations. Many were drawn decades ago, some have not kept pace with new development or updated rainfall data, and a property outside the mapped zone can still flood. A map revision program exists, yet gaps remain. Treating the map line as a guarantee of safety is a mistake that shows up in claim statistics year after year. (The row)
In Europe, the framework is different but the logic is similar. European Union member states are required to assess flood risk, map flood hazard and risk, and produce flood risk management plans on a repeating cycle. The requirement pushed many countries to publish hazard maps for the first time and to separate hazard (where water goes) from risk (what is harmed), exactly the distinction described above.
Why the Hazard Is Changing
The baseline assumption behind older maps, that the climate of the past predicts the floods of the future, no longer holds. The Sixth Assessment Report of the Intergovernmental Panel on Climate Change concluded that human-induced climate change has increased the frequency and intensity of heavy precipitation in most regions. More intense rainfall raises flood hazard in many places, though the strength of the signal varies by region and by flood type. Confidence is generally higher for pluvial flooding driven by short, intense downpours than for every kind of river flood everywhere.
The historical record already shows the pattern. A World Meteorological Organization atlas covering 1970 to 2019 identified floods among the hazards responsible for the largest numbers of deaths and the heaviest economic losses worldwide during that period. The Emergency Events Database maintained by CRED at UCLouvain, which tracks disasters back to 1900, has consistently recorded floods as one of the most frequent disaster categories globally. Exact counts shift as the database is updated, so live figures are the ones to quote.
Two cautions are worth keeping in mind. First, future flood exposure estimates depend heavily on which emissions scenario is used, how a return period is defined, and whether population growth is factored in. Different studies produce different magnitudes, and no single number should be presented as settled. Second, a changing hazard does not automatically mean a changing risk in every location, because exposure and vulnerability move too. A growing city on a floodplain can see risk rise even if the hazard stays flat.
Reading a Flood Hazard Map Without Being Fooled
Hazard maps are tools, and like any tool they work best when the user knows their limits. A few habits separate careful readers from confused ones.
- Check the date. A map drawn before the last major development upstream may describe a river that no longer exists in the same form.
- Identify the flood type. Confirm whether the map shows river flooding, surface water, coastal flooding, or all three. A map missing pluvial flooding can leave whole neighborhoods looking safe.
- Look for the return period. Maps usually show more than one scenario, often the 100-year and the 500-year lines. Know which line you are reading.
- Separate hazard from risk layers. The hazard layer shows water; the risk layer shows damage. They answer different questions.
- Ask about modeling assumptions. Rainfall data, drainage capacity, and defense maintenance all feed the model, and all can be out of date.
A common practical mistake is treating the edge of a mapped floodplain as a hard boundary. Water does not read maps. Properties just outside the line flood regularly, and the further a map gets from its modeling date, the wider that gray zone becomes.
How Hazard Information Turns into Action
Knowing the hazard is only useful if it changes decisions. In practice, flood hazard data flows into several channels.
Land-use planning is the most powerful. Zoning that keeps new construction out of high-hazard zones prevents risk from being created in the first place, which is far cheaper than retrofitting later. Building codes translate hazard into elevation requirements, flood-resistant materials, and foundation standards. Insurance uses hazard maps to set premiums and, in some systems, to require coverage. Emergency planning uses hazard scenarios to design evacuation routes and warning triggers.
There is a social dimension too. Hazard information is not distributed evenly. Communities with fewer resources often have older maps, weaker enforcement, and less capacity to act on what the data says. That gap turns a shared physical hazard into unequal risk, and it is one reason flood policy debates are rarely only about water.
Hair and beauty analogies aside, the deeper point is that hazard awareness is a form of literacy. Just as someone learning to care for 4c hair has to understand porosity and protein balance rather than just buying products, a resident reading a flood map has to understand return periods and model dates rather than just checking whether the house is inside a colored line. The surface detail is less important than the underlying structure. (2b hair)
Practical Steps for Households and Small Businesses
For anyone who wants to act on flood hazard information rather than just read about it, a short checklist helps.
- Find the current hazard map for the property and note its publication date.
- Ask the local planning office whether surface-water flooding is included, since many older maps omit it.
- Document the elevation of the lowest floor and any basement openings.
- Keep gutters, drains, and nearby culverts clear; poor maintenance turns moderate rainfall into a local hazard.
- Store insurance and property documents somewhere waterproof or digital.
- Know the difference between a watch and a warning, and know the route out.
None of this requires expertise. It requires treating the hazard as real before the water arrives.
Conclusion
Amenaza de inundación names something specific: the physical possibility that water will arrive in a place, measured in return periods and mapped in zones. It is not the same as risk, and treating the two as synonyms causes real harm, from misread maps to underprepared neighborhoods. The hazard itself is shifting as heavy rainfall intensifies in many regions, while the maps that describe it often lag behind. The most useful response is neither panic nor complacency but literacy: knowing which flood type applies, which scenario a map shows, and when it was last updated. Water will do what water does. The job of people is to see it coming.
Frequently Asked Questions
What does “amenaza de inundación” mean in English?
It translates as flood hazard: the physical possibility of flooding in a given area, described independently of who or what is exposed. It is a hazard term, not a risk term, and the distinction matters in planning and insurance.
Is a 100-year flood the same as a flood that happens once a century?
No. A 100-year flood has about a 1 percent chance of occurring in any single year. Over a 30-year mortgage, that adds up to roughly a one-in-four chance of at least one such flood at a given location, which is why the phrase misleads so many people.
Does living outside a mapped floodplain mean a property is safe?
Not necessarily. Maps have publication dates, modeling assumptions, and coverage gaps, and surface-water flooding is often missing from older maps. Properties just outside a mapped zone do flood, so the map line is a planning tool rather than a guarantee.
What is the difference between flood hazard and flood risk?
Hazard is the water’s potential behavior. Risk combines hazard with vulnerability and exposure, meaning the people, buildings, and infrastructure that could be harmed. An empty floodplain has hazard but no risk; a dense neighborhood in the same place has both.
Why are flood hazard maps sometimes out of date?
Mapping is expensive and slow, and conditions change faster than revisions arrive. New development alters drainage, rainfall records get updated, and defense infrastructure ages. Many agencies run revision programs, but coverage and currency vary widely between regions.
How is climate change affecting flood hazard?
Heavy precipitation has become more frequent and intense in most regions, which raises flood hazard in many areas. The strength of the effect varies by region and flood type, and future estimates depend on the scenario used, so experts avoid presenting any single figure as certain.